The latest FT-ICSA Boardroom Bellwether shows a trend toward greater interest in social media within FTSE 350 boardrooms.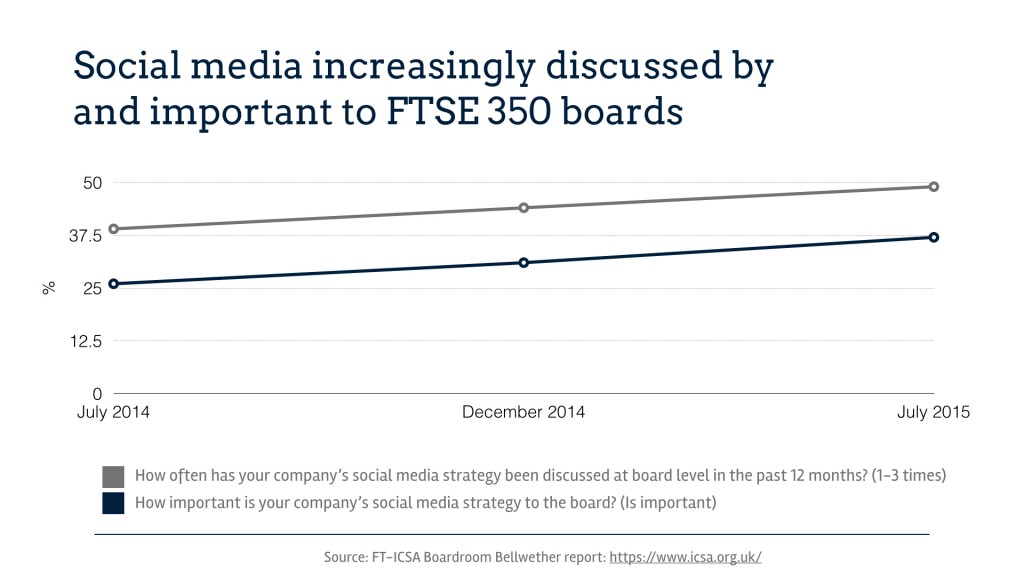
The latest Bellwether report can be viewed here.
Social media. Copywriting. Building stronger businesses.
The latest FT-ICSA Boardroom Bellwether shows a trend toward greater interest in social media within FTSE 350 boardrooms.
The latest Bellwether report can be viewed here.
Each year the University of Oxford’s Reuters Institute for the Study of Journalism publishes its Digital News Report. Covering 12 countries, it is one of the most thorough studies about the way we consume news online.
The 2015 report is useful but the raw data tables even more so. I’ve waded through the UK-specific data and extracted these three findings.
Traditional media (TV, radio and print) retains its hold on our attention with 85% of those surveyed saying they access news through these channels during an average week. Online news consumption is catching up with almost three-quarters (73%) of UK adults accessing news digitally.
We might be embracing digital news, but established news brands are in a strong position.
Four in five (82%) of those accessing online news, access the website or app of a traditional news brand. Of those who access news on their smartphone, half use a single source on their phone.

Online, one brand stands out above all others: the BBC. It is the most widely used news source across all devices, from smartphones (62%) to desktops (66%), and also leads on app usage.
Newspapers, seeing falling print sales, face a tricky conundrum with online audiences. The study reveals 38% of UK adults read a paper and 35% read the website or app of a newspaper.
Digital audiences are gaining parity. The problem is the digital audience will not pay.
Three-quarters (73%) of UK adults say they are very unlikely to pay for online news.

Only 6% say they have paid for news online in the part year and the same percentage say they are likely to in the future. Online news will continue to rely heavily on advertising and other commercial revenue.
According to Ofcom, almost half (47%) of British adults use social networking sites. However, the Digital News report found that only one in seven (14%) of UK adults share news on a social network during an average week.

Unsurprisingly, Twitter features strongly as a news source. Of those surveyed, almost two-thirds (64%) of those who use it said they “think of it as a useful way of getting news.”

Conversely, nearly two-thirds (62%) of Facebook users agreed with the statement, “I mostly see news when I’m on it for other reasons.”
In this respect, Facebook reflects the real world where a lot of news is shared socially while talking about things in general.
Facebook is also winning. Its scale means that three in 10 (29%) of UK adults find, read, watch, share or discuss news on Facebook. It is the leading social network for news in the UK.

About half the number (14%) of UK adults do the same on Twitter. More digital news is being picked up by incident than by intent.
A presentation with some of this data, and more, from the report can be viewed on slideshare.
This article was originally posted here on Stephen Waddington’s blog.
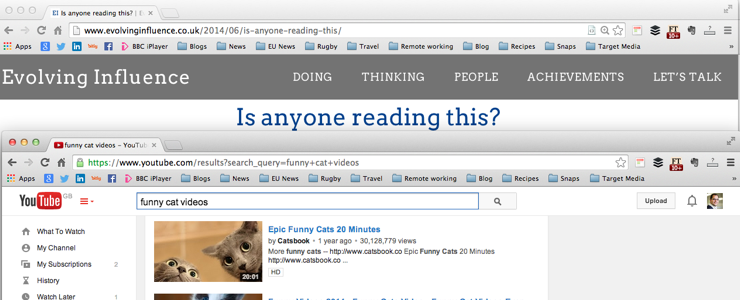
We’re all creating content and we all want to know if it’s being read, so how can we work that out?
Medium, who really do seem to be the innovators in the online publishing space, display a “reading time” metric at the top of every article, which is a very useful number for working out whether your work is being read.
If you publish your work on Medium, you get access to information on the number of people who viewed an article and, crucially, the number of people who have read it. But what if you don’t solely publish on Medium?
Well, helpfully, Medium’s Nick Fisher recently wrote an article explaining how Medium calculate their reading time metric, so with some simple spread sheet work and a little time spent within your analytics data, you too can work out if your blogposts are being read (or get a good idea at the very least).
Nick’s explanation about how Medium calculate reading time is clear and thorough, so I’m not going to try and re-write here, but what I have done is create Excel and Google Drive formulas which let you enter the total number of words an article has and the number of images it contains (up to a maximum of 10), it then returns a reading time metric measured in minutes and seconds.
The Google Drive sheet is saved here. Please do feel free to use it, share it or pick it apart.
If you’d like the Excel version or you’d like to learn more about how I constructed the formula, just drop me an email.
Two caveats I’d like to throw in are: